Macroscale resilience
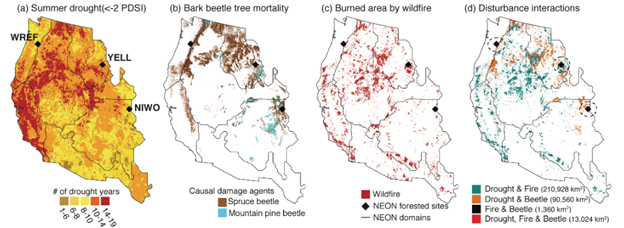
Across the Western U.S., an estimated 6.3 billion dead trees stand as evidence of increasingly severe and frequent beetle outbreaks, wildfires, and droughts, all intensified by decades of regional warming. Yet, a critical question remains: Are these forests transitioning to new ecological states, or are they showing signs of resilience?
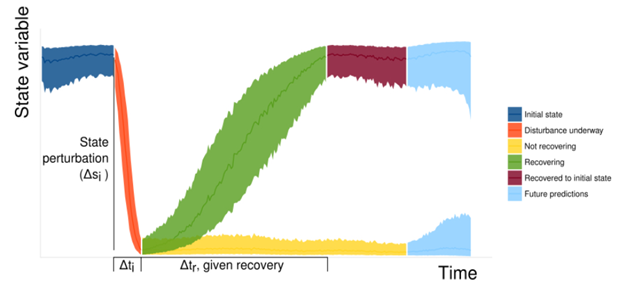
Despite advances in resilience theory, measuring forest recovery, especially in response to compounding disturbances, remains a challenge. To bridge this gap, our research combines field-based forest inventories, uncrewed aerial systems (UAS, i.e., “drones”), the National Ecological Observatory Network’s (NEON) Airborne Observation Platform (AOP), and Landsat data. Our goal is to track plant functional types over time at a landscape scale, providing key insights into forest recovery.
By reconstructing forest dynamics at a spatial scale relevant to land management, this research delivers a first-of-its-kind temporal analysis of ecosystem resilience. We are also committed to developing an open, reproducible methodology that can address ecological questions at regional to continental scales, shaping future forest management strategies.